Rodrigo Morais
I am looking to transition into a Data Science focused area, following more than two decades as a Senior Software Engineer. I’ve always had a strong Data focus throughout my entire career, and now that these roles have become more delineated, I’d like to dedicate myself more fully to Data Science topics.
|
Portfolio
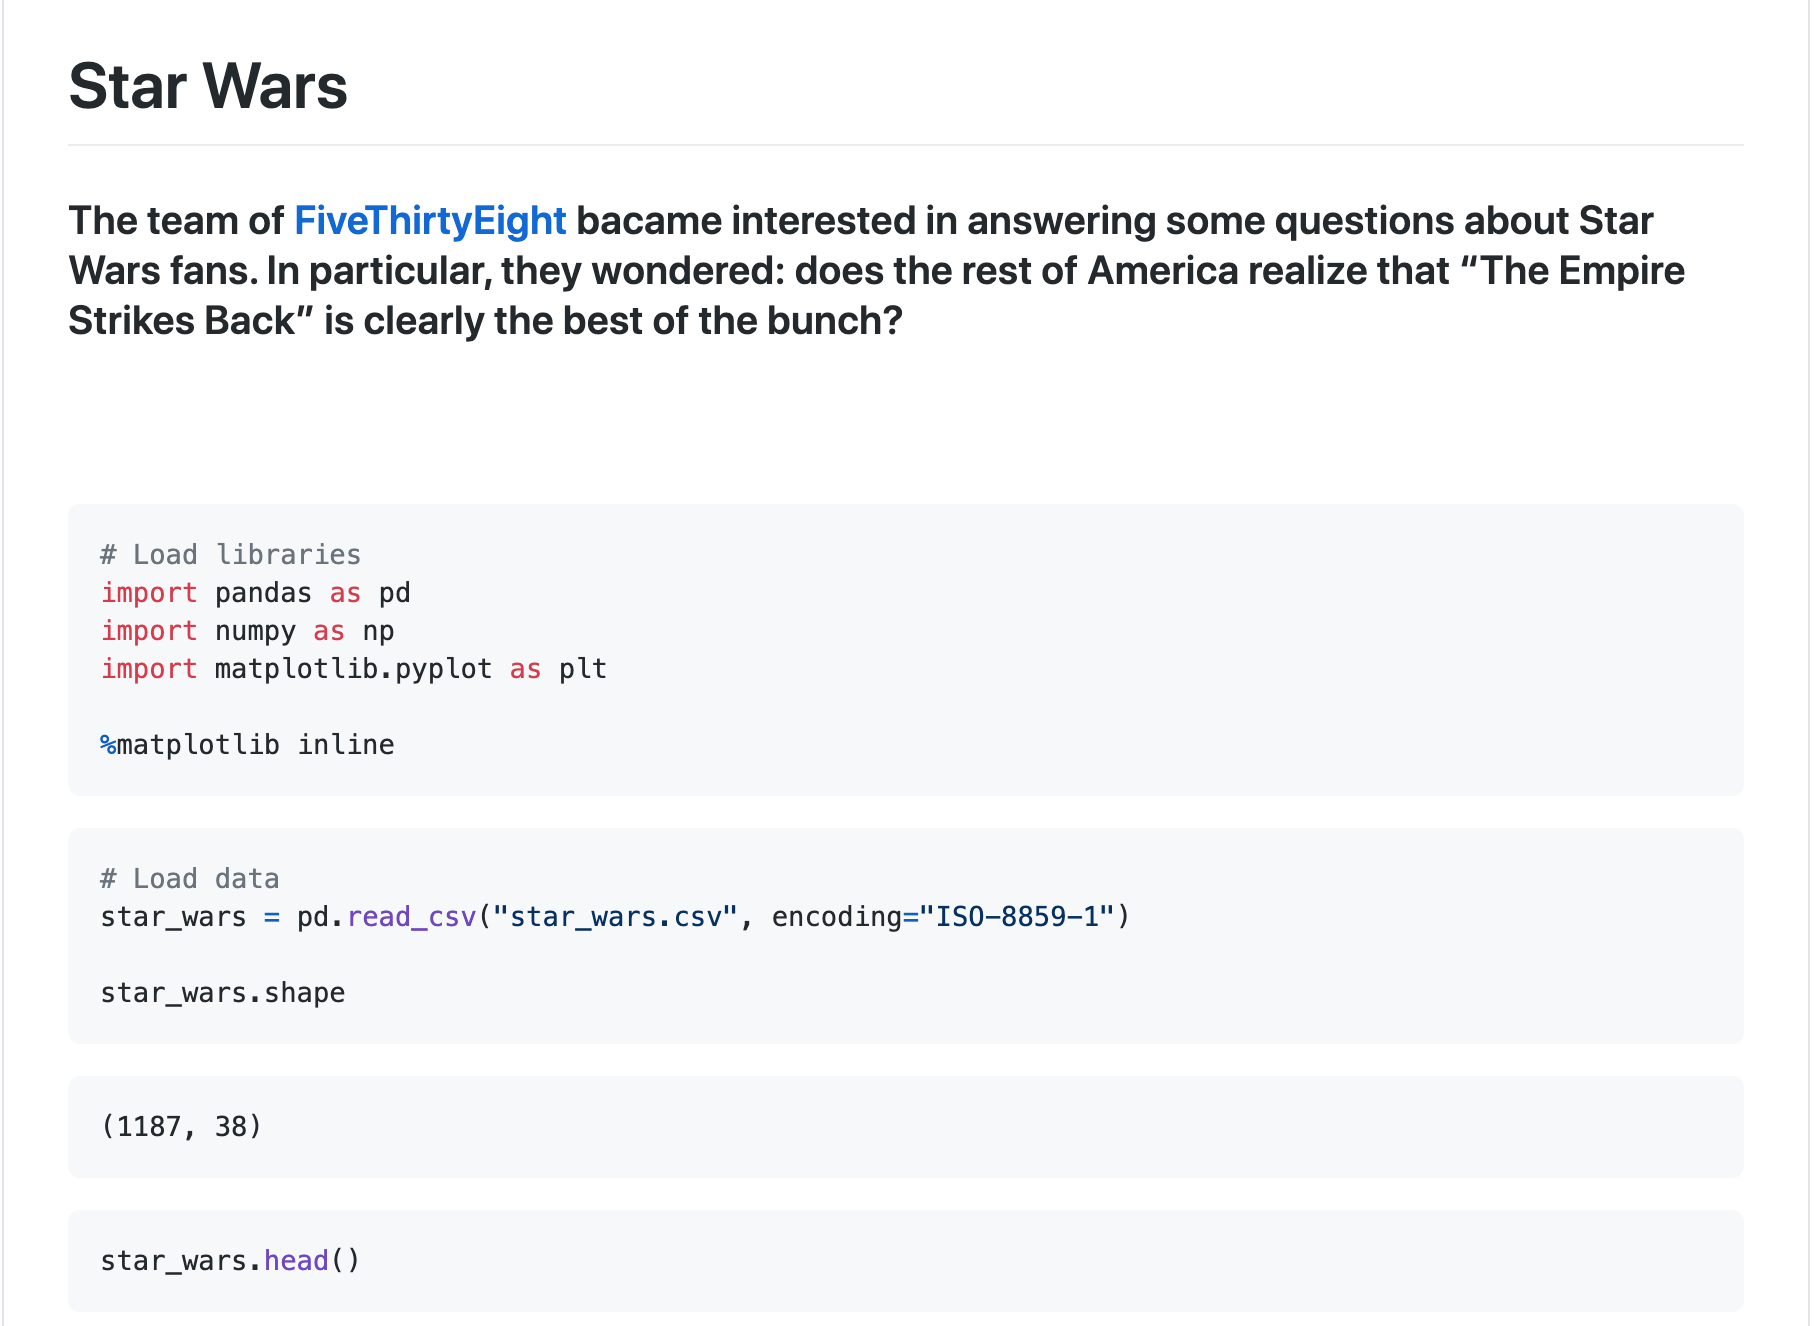
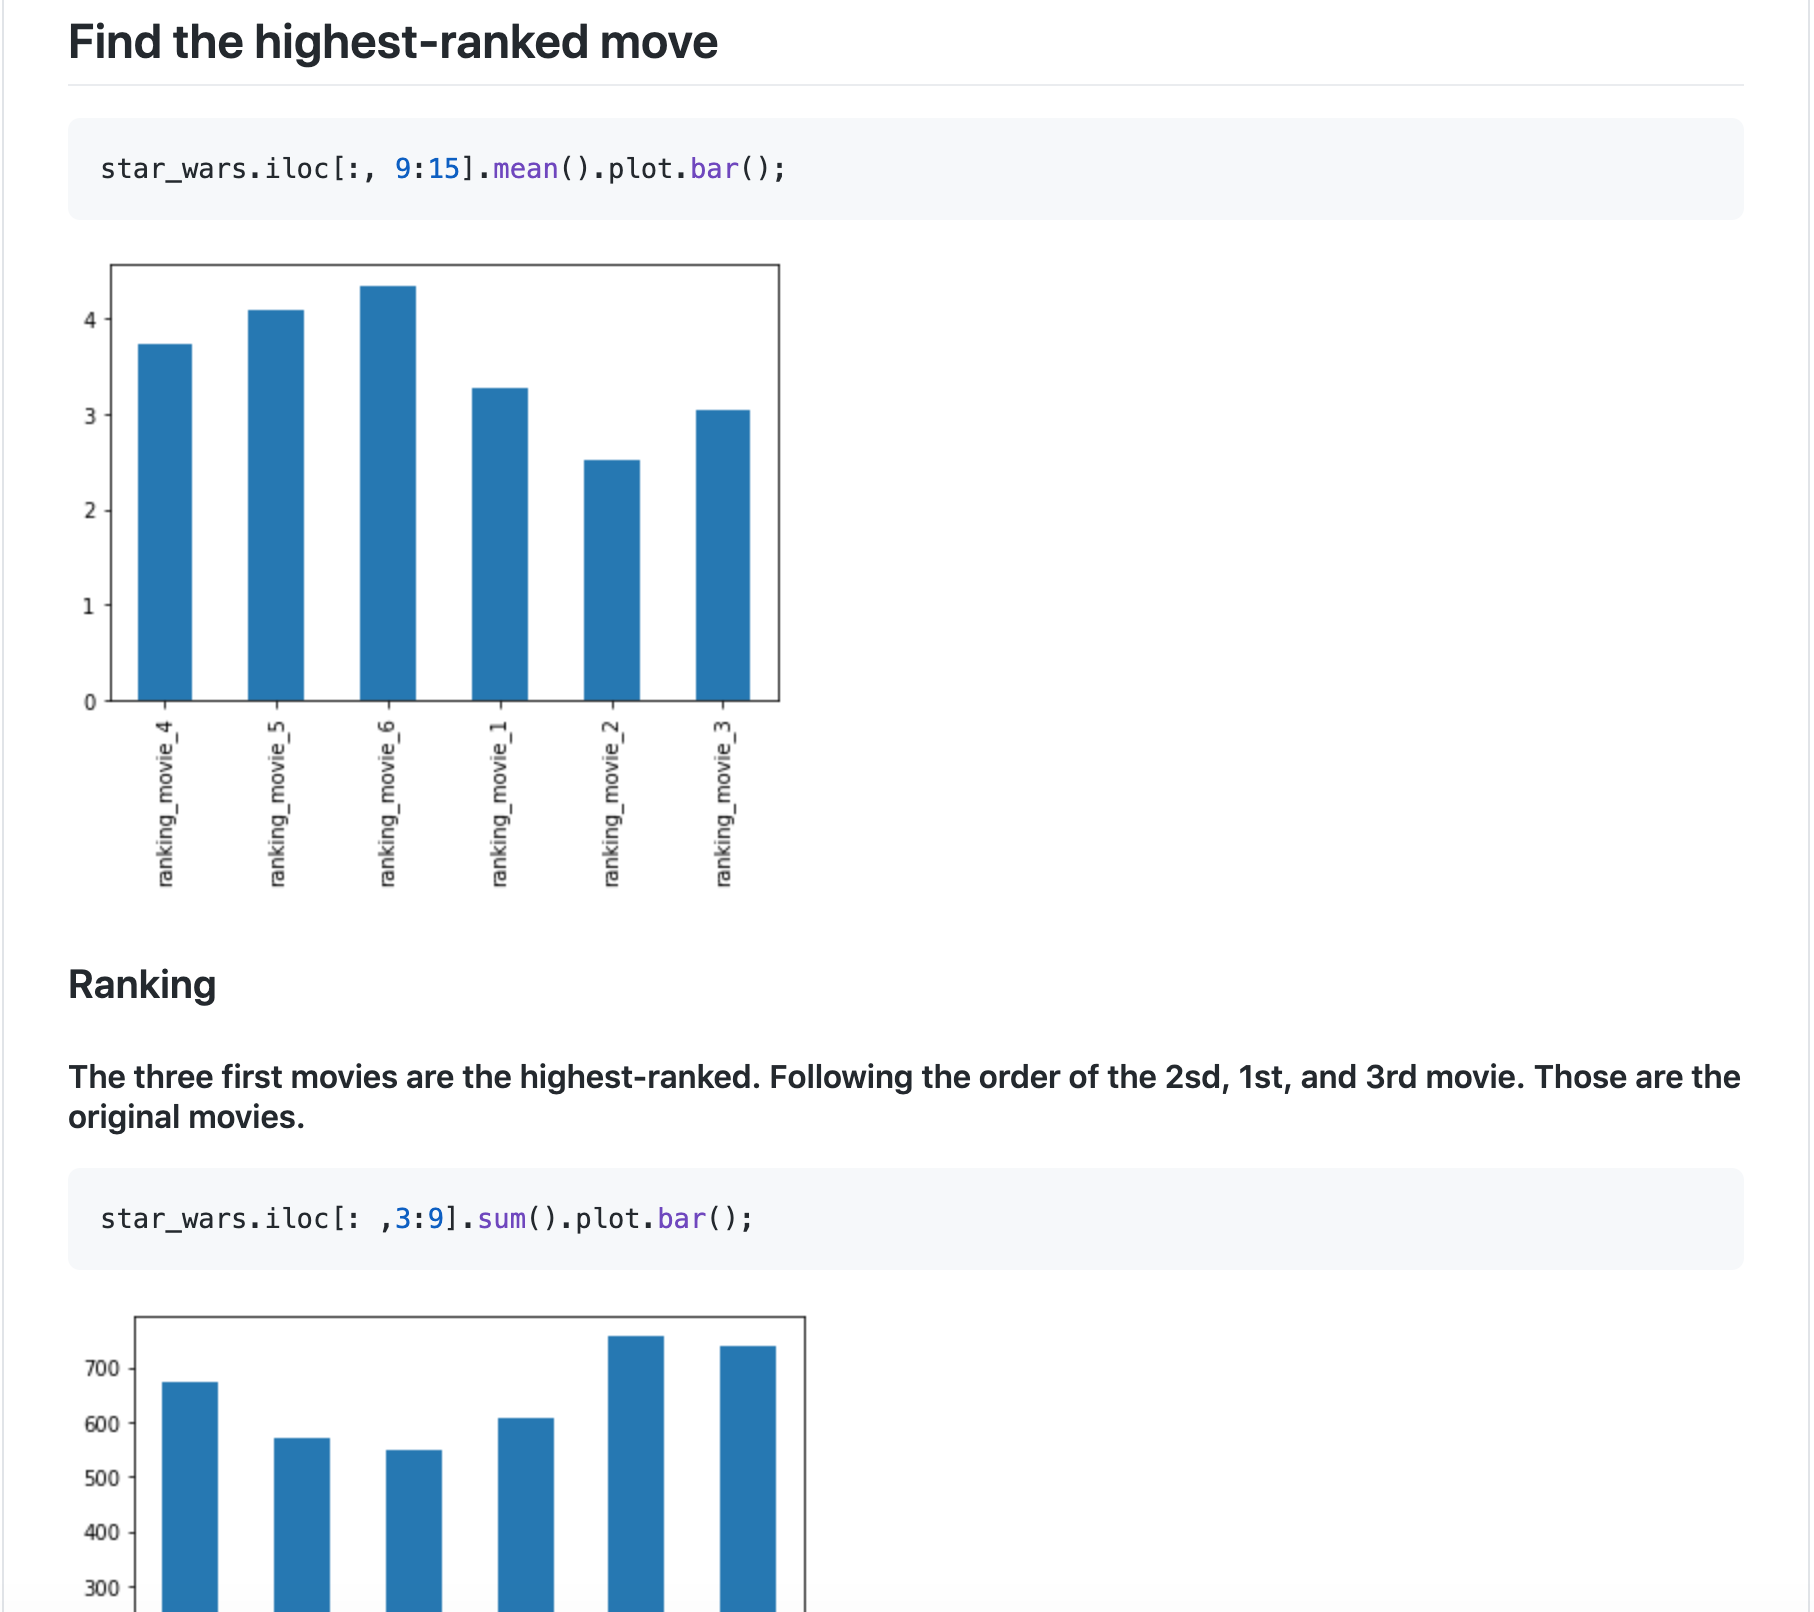
Star Wars
A study about Star War movies and their fans.
 GitHub
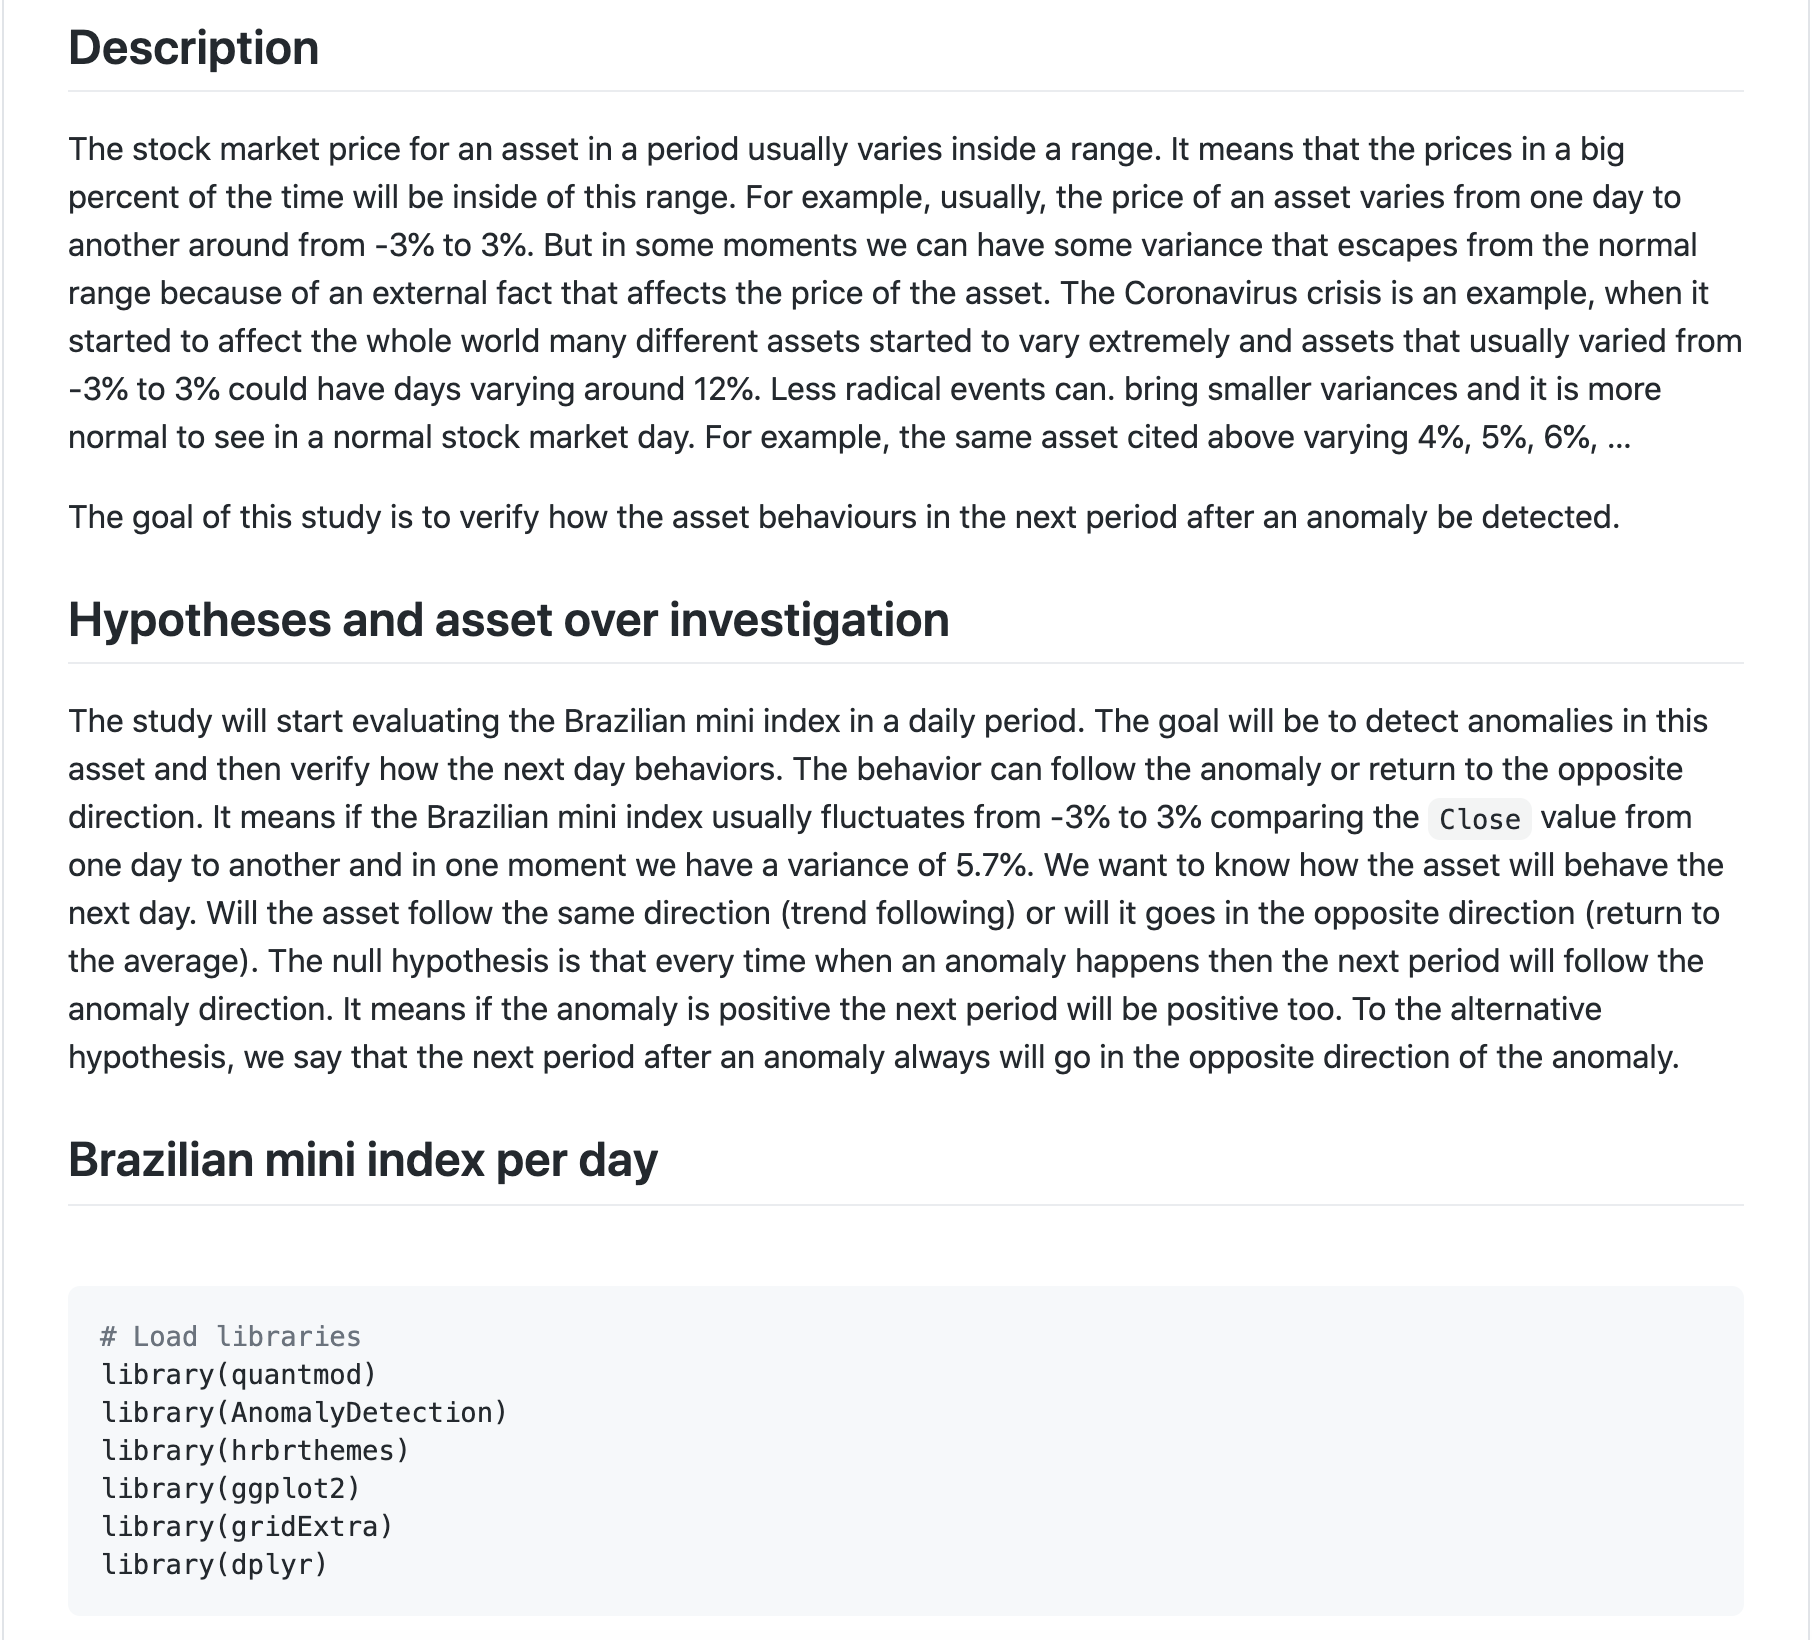
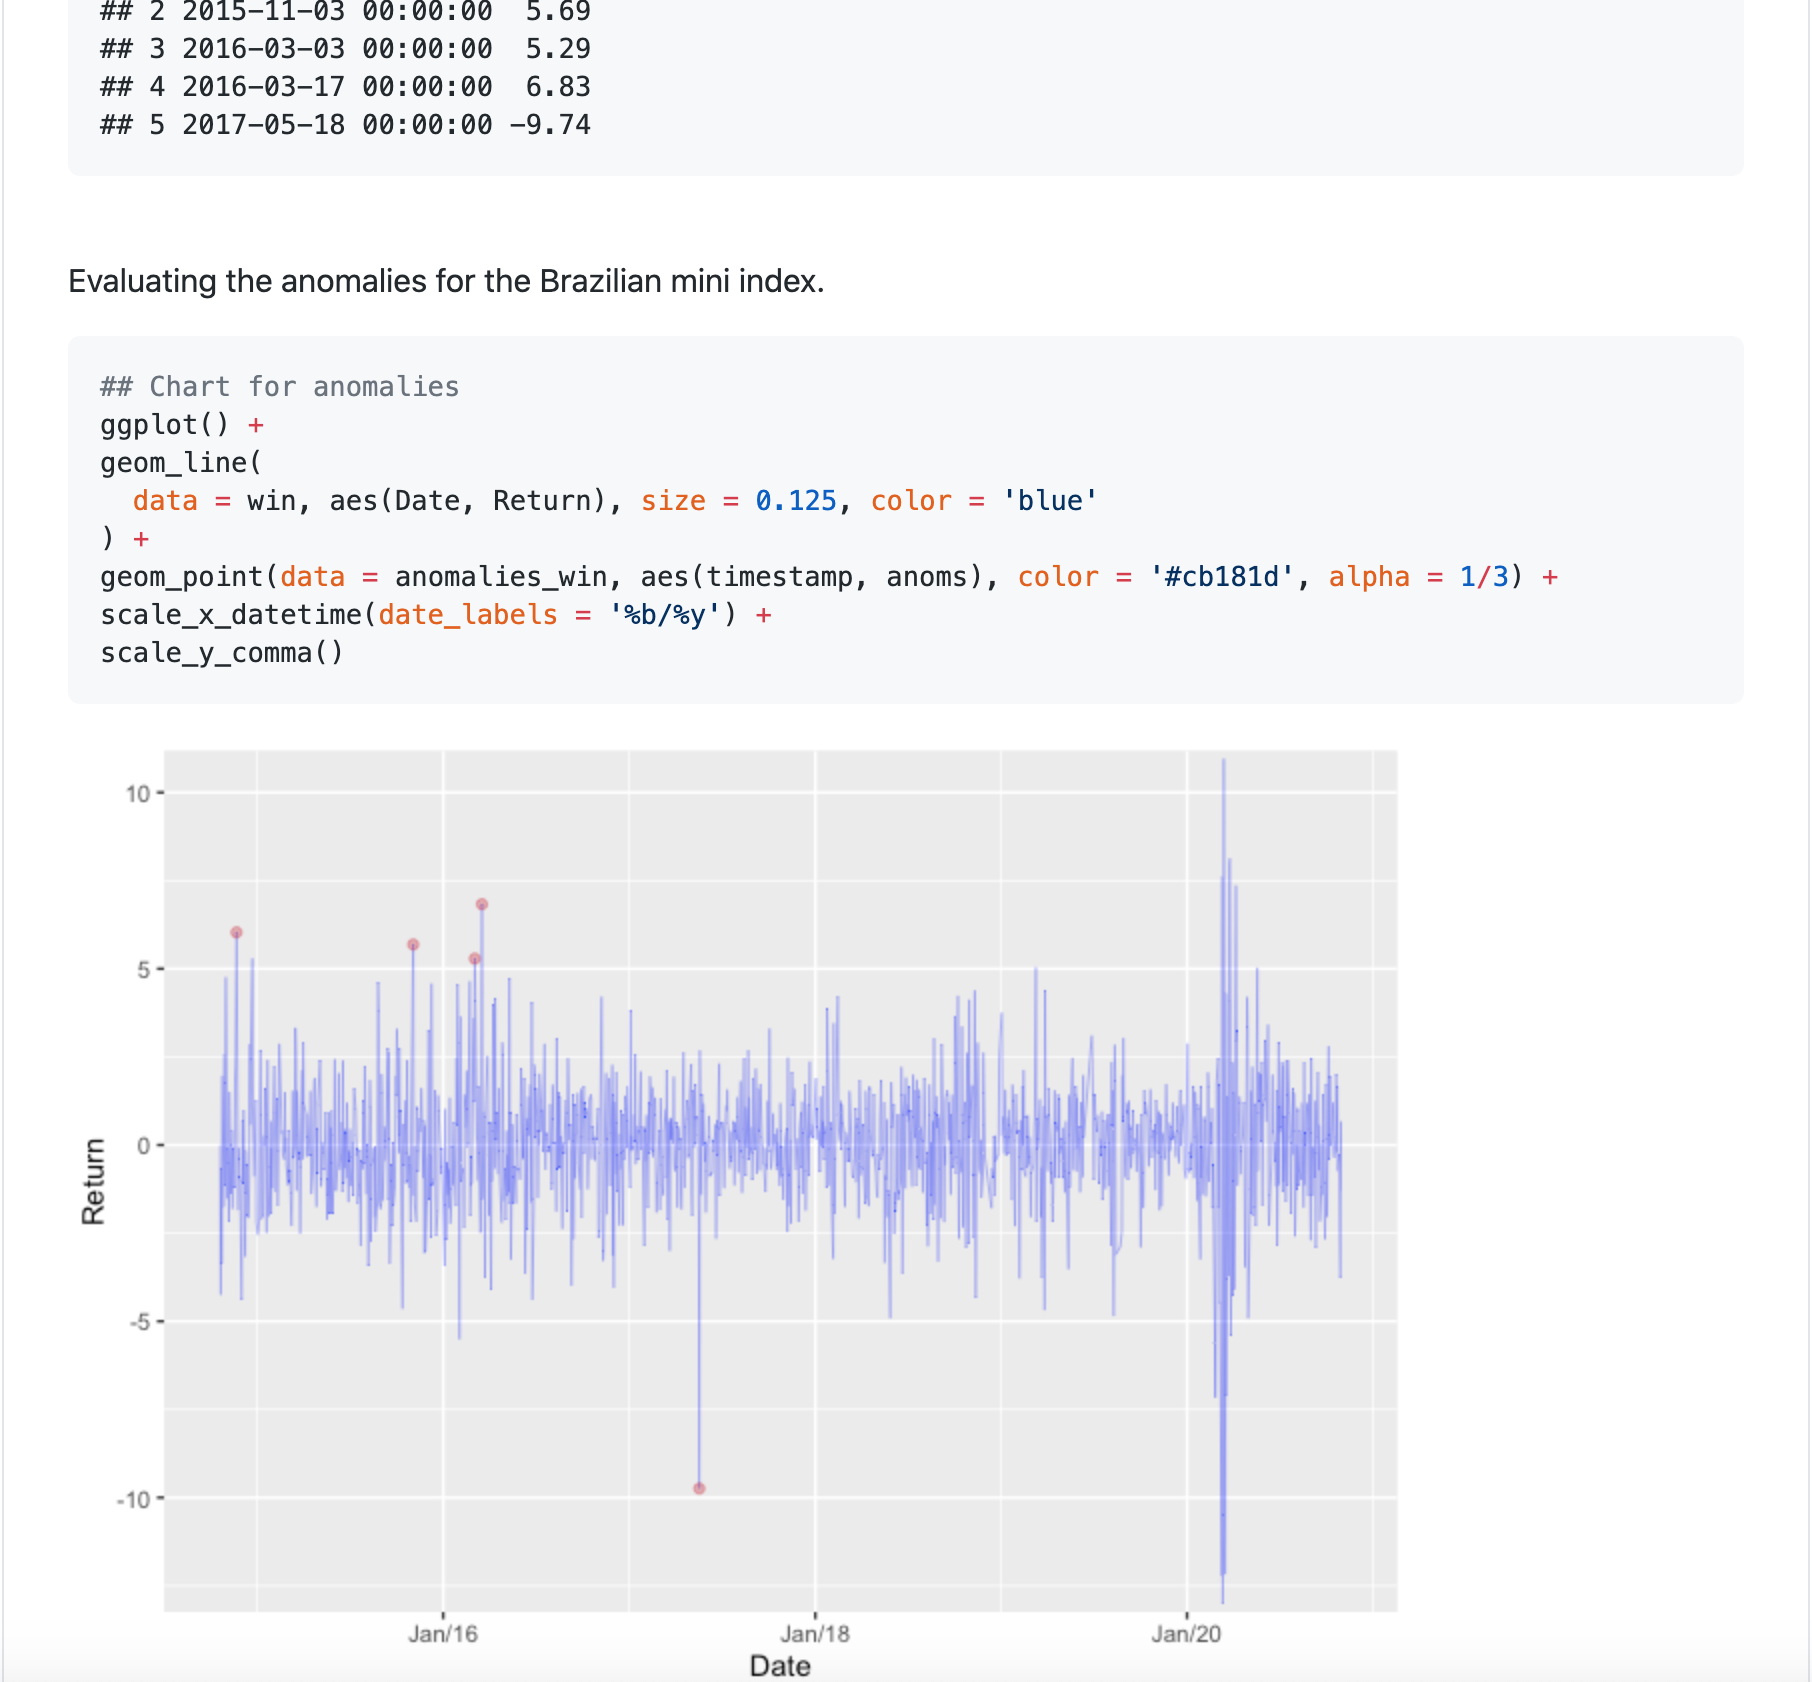
Stock market anomalies
A study about some assets in the Brazilian stock market and how they behave when the prices are anomalous.
 GitHub
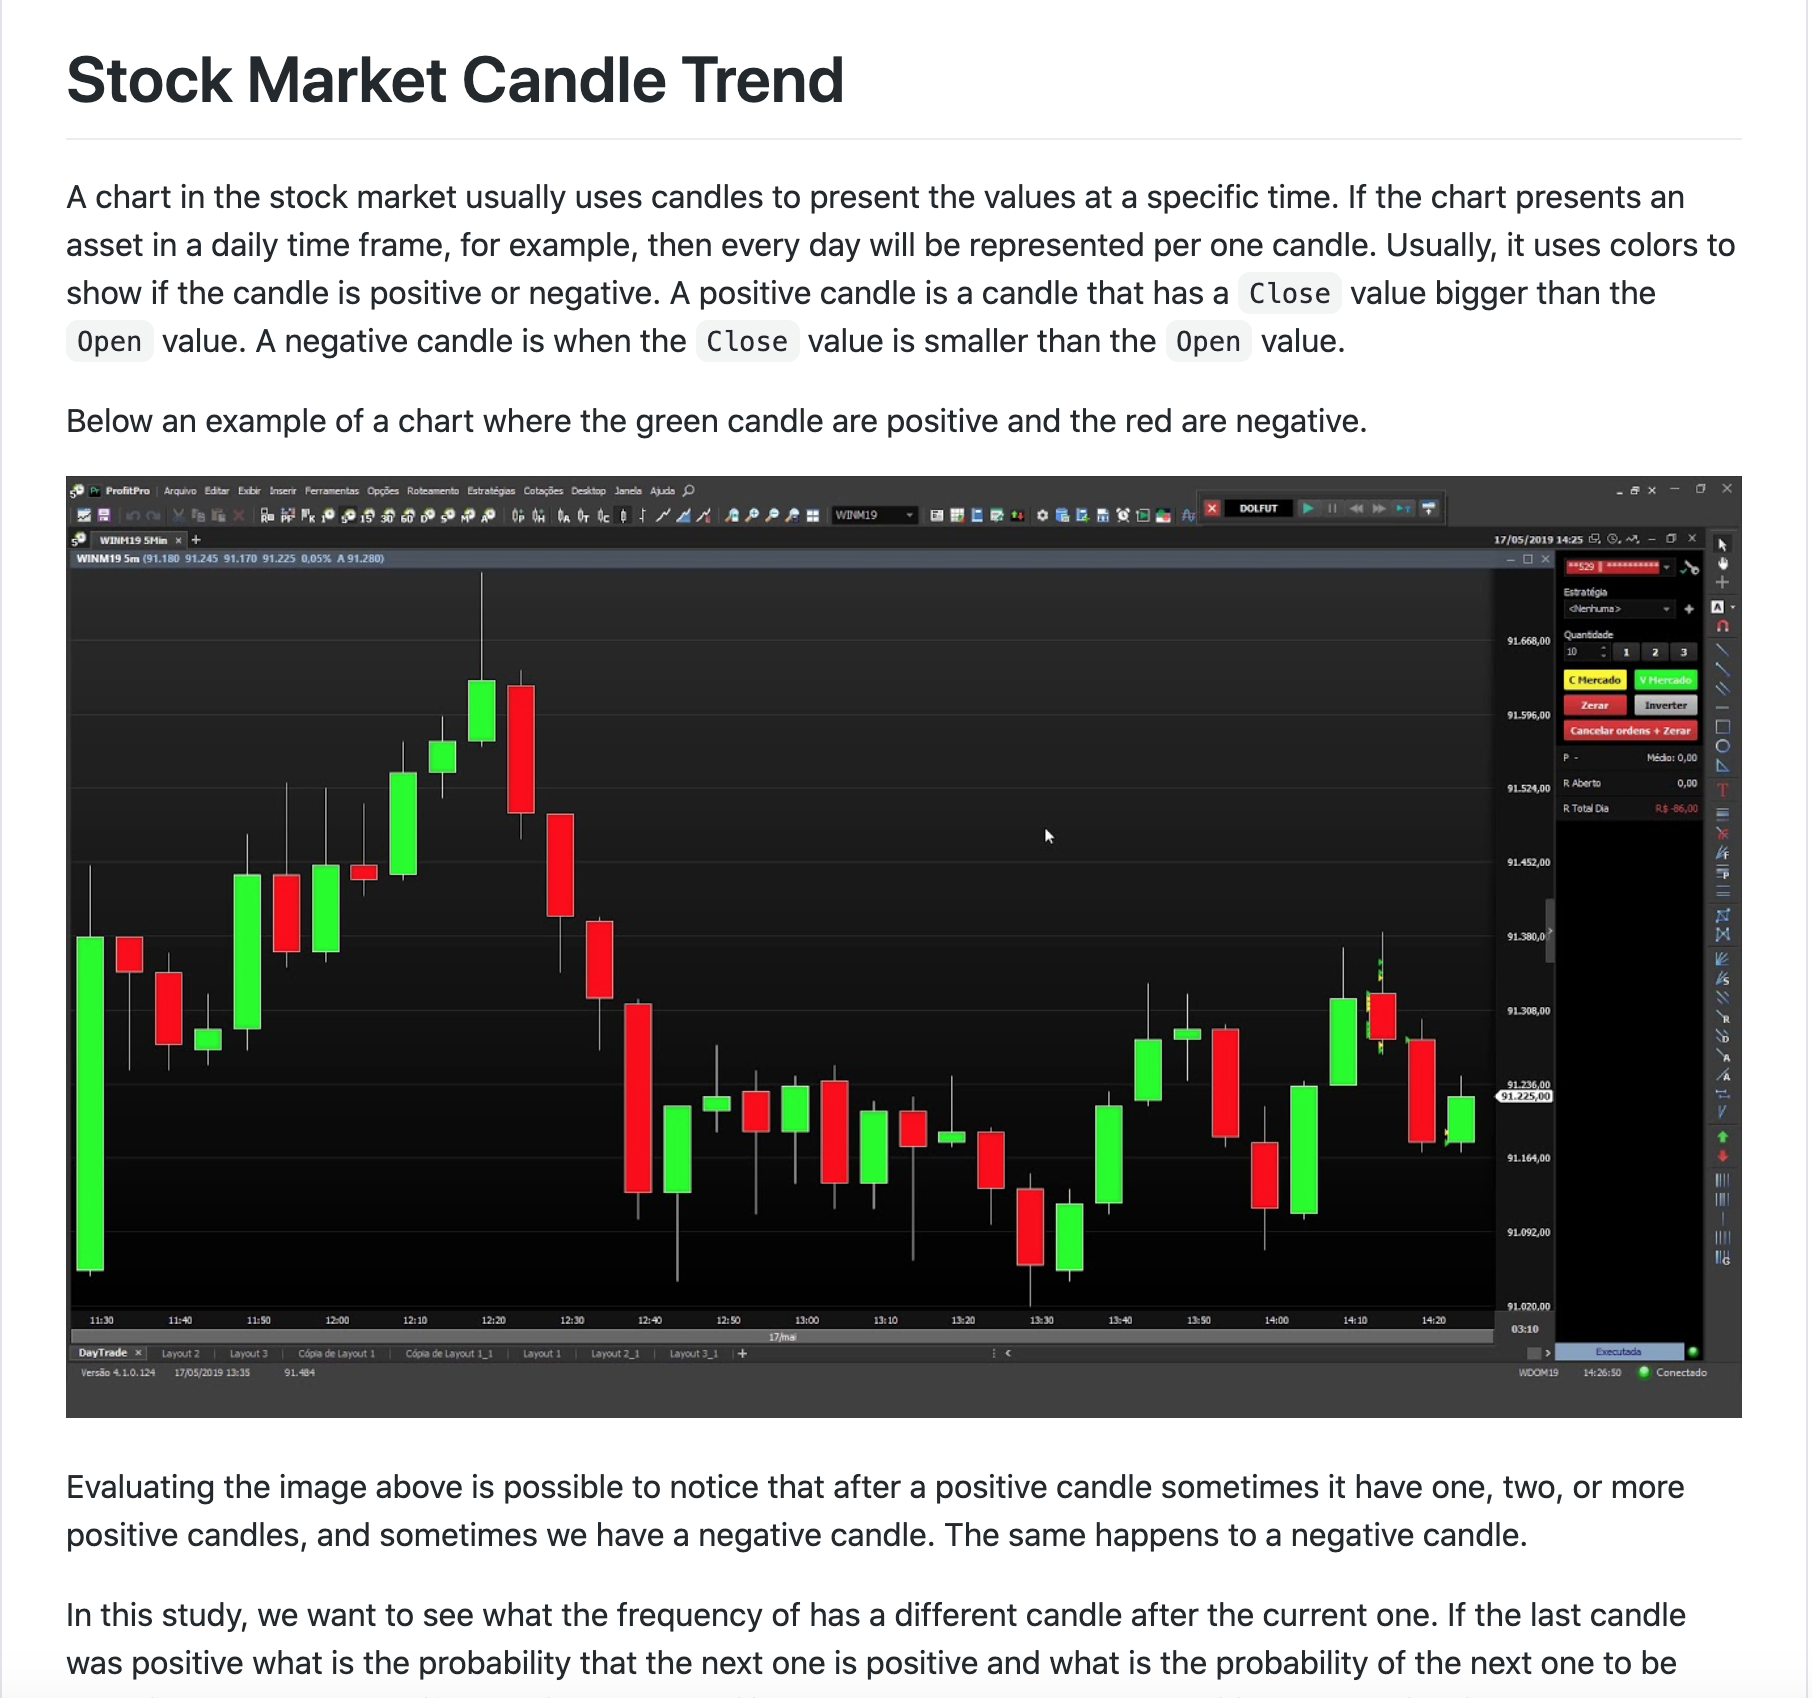
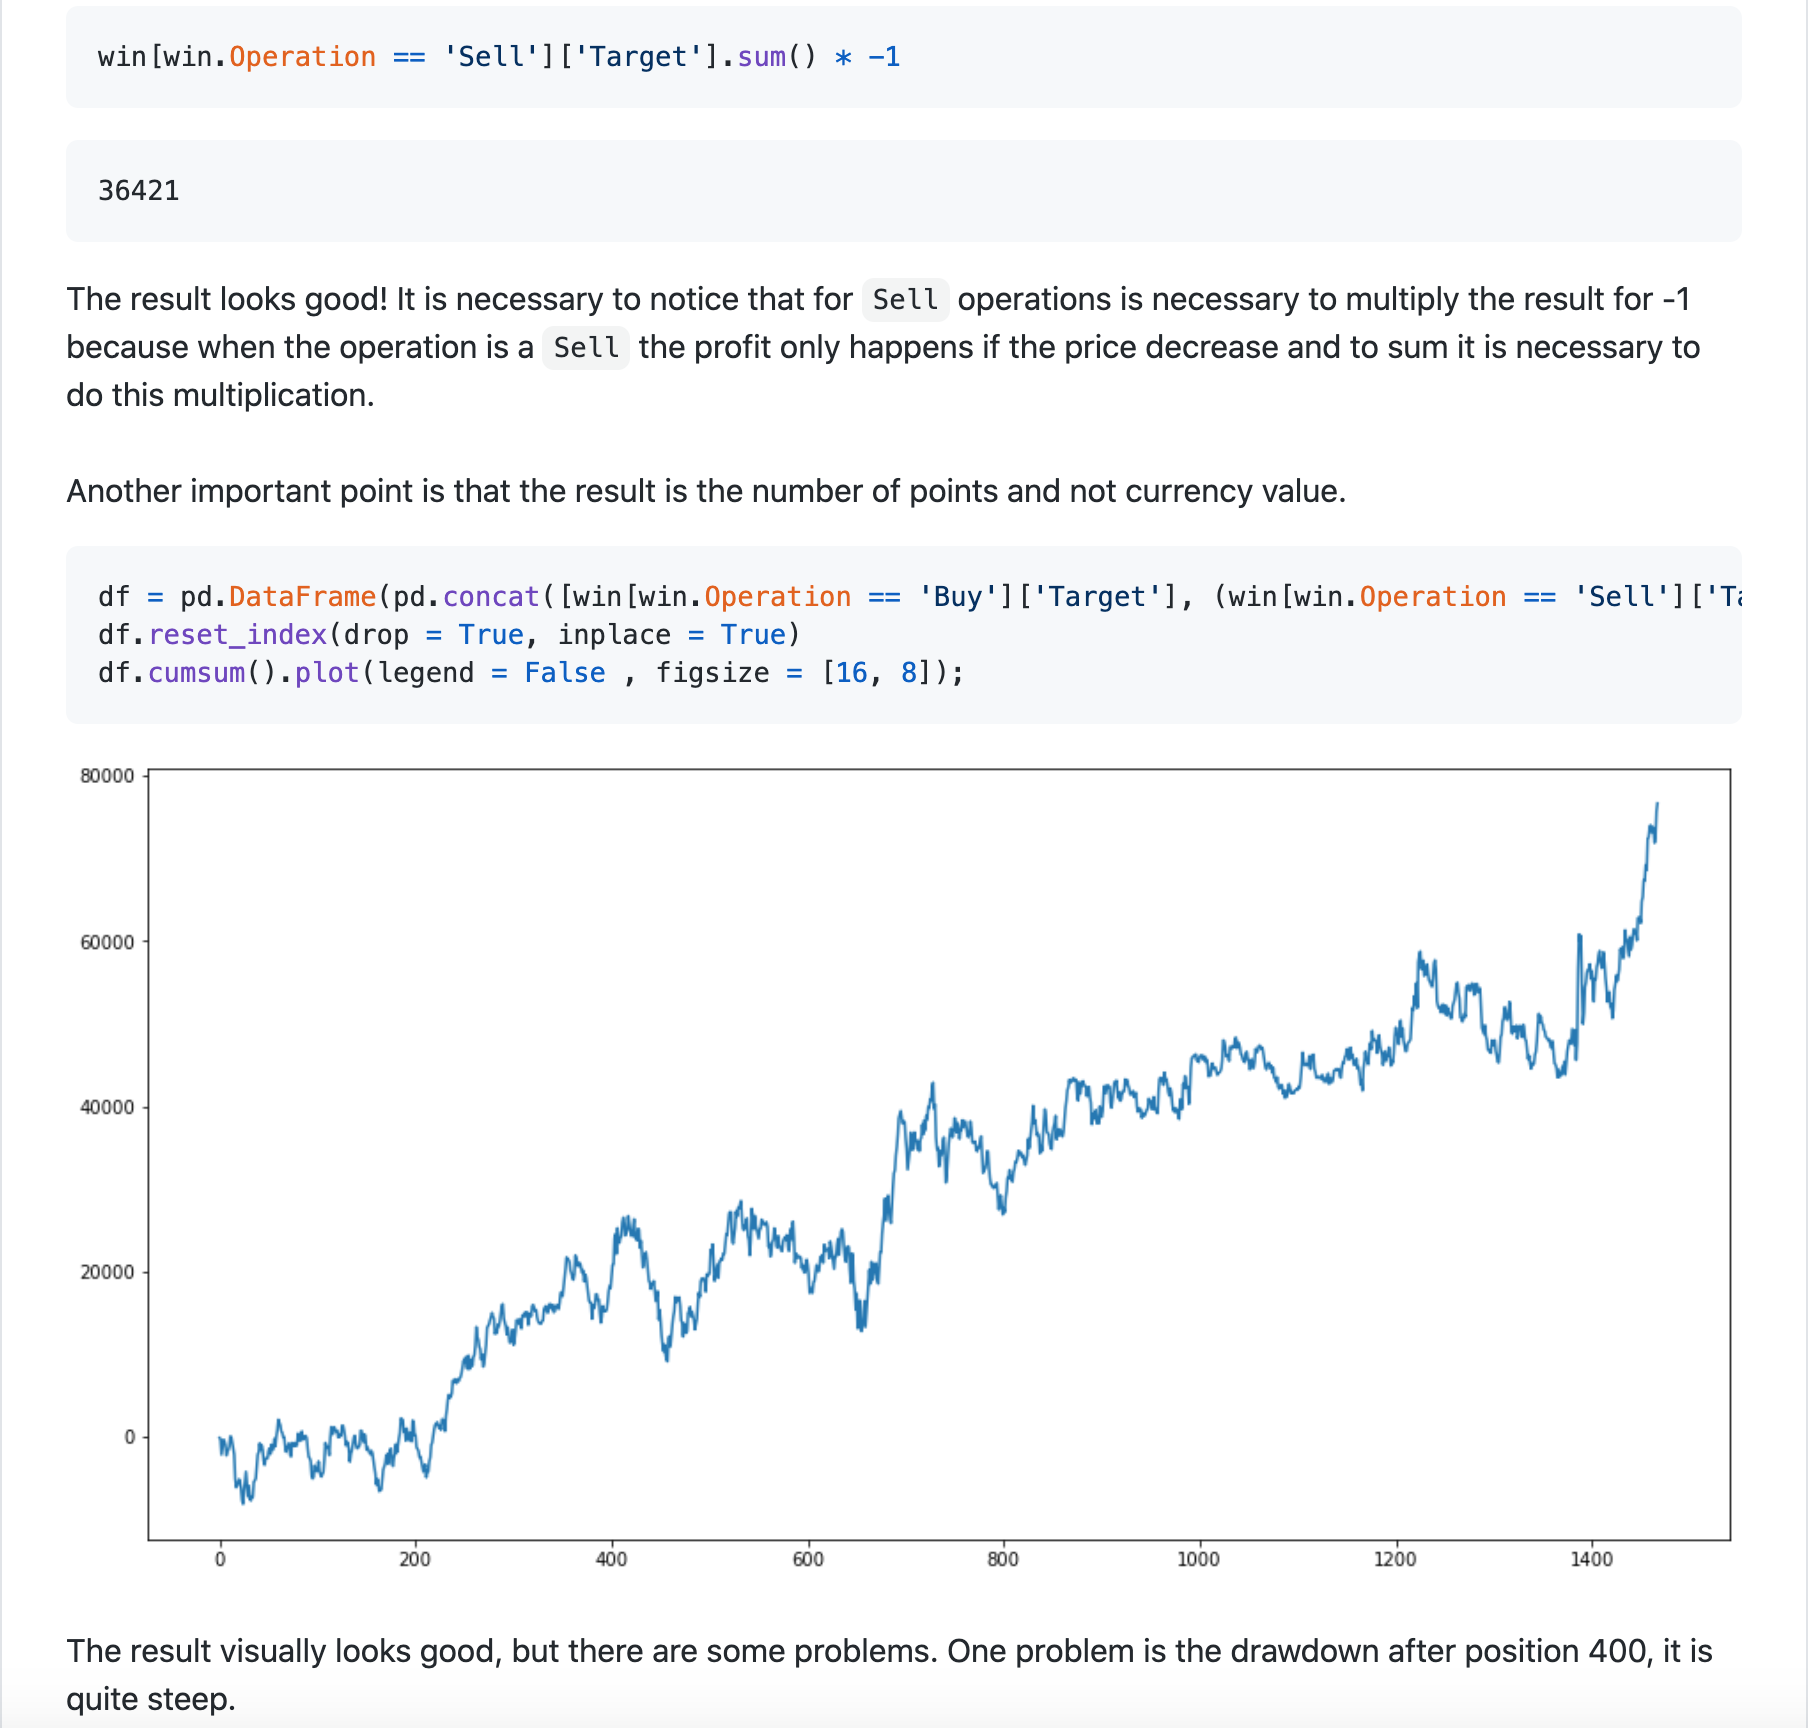
Stock market candles
A study about some assets in the Brazilian stock market and how they behave after a positive or negative candle. Are the assets following a trend or they are returning to the average price?
 GitHub
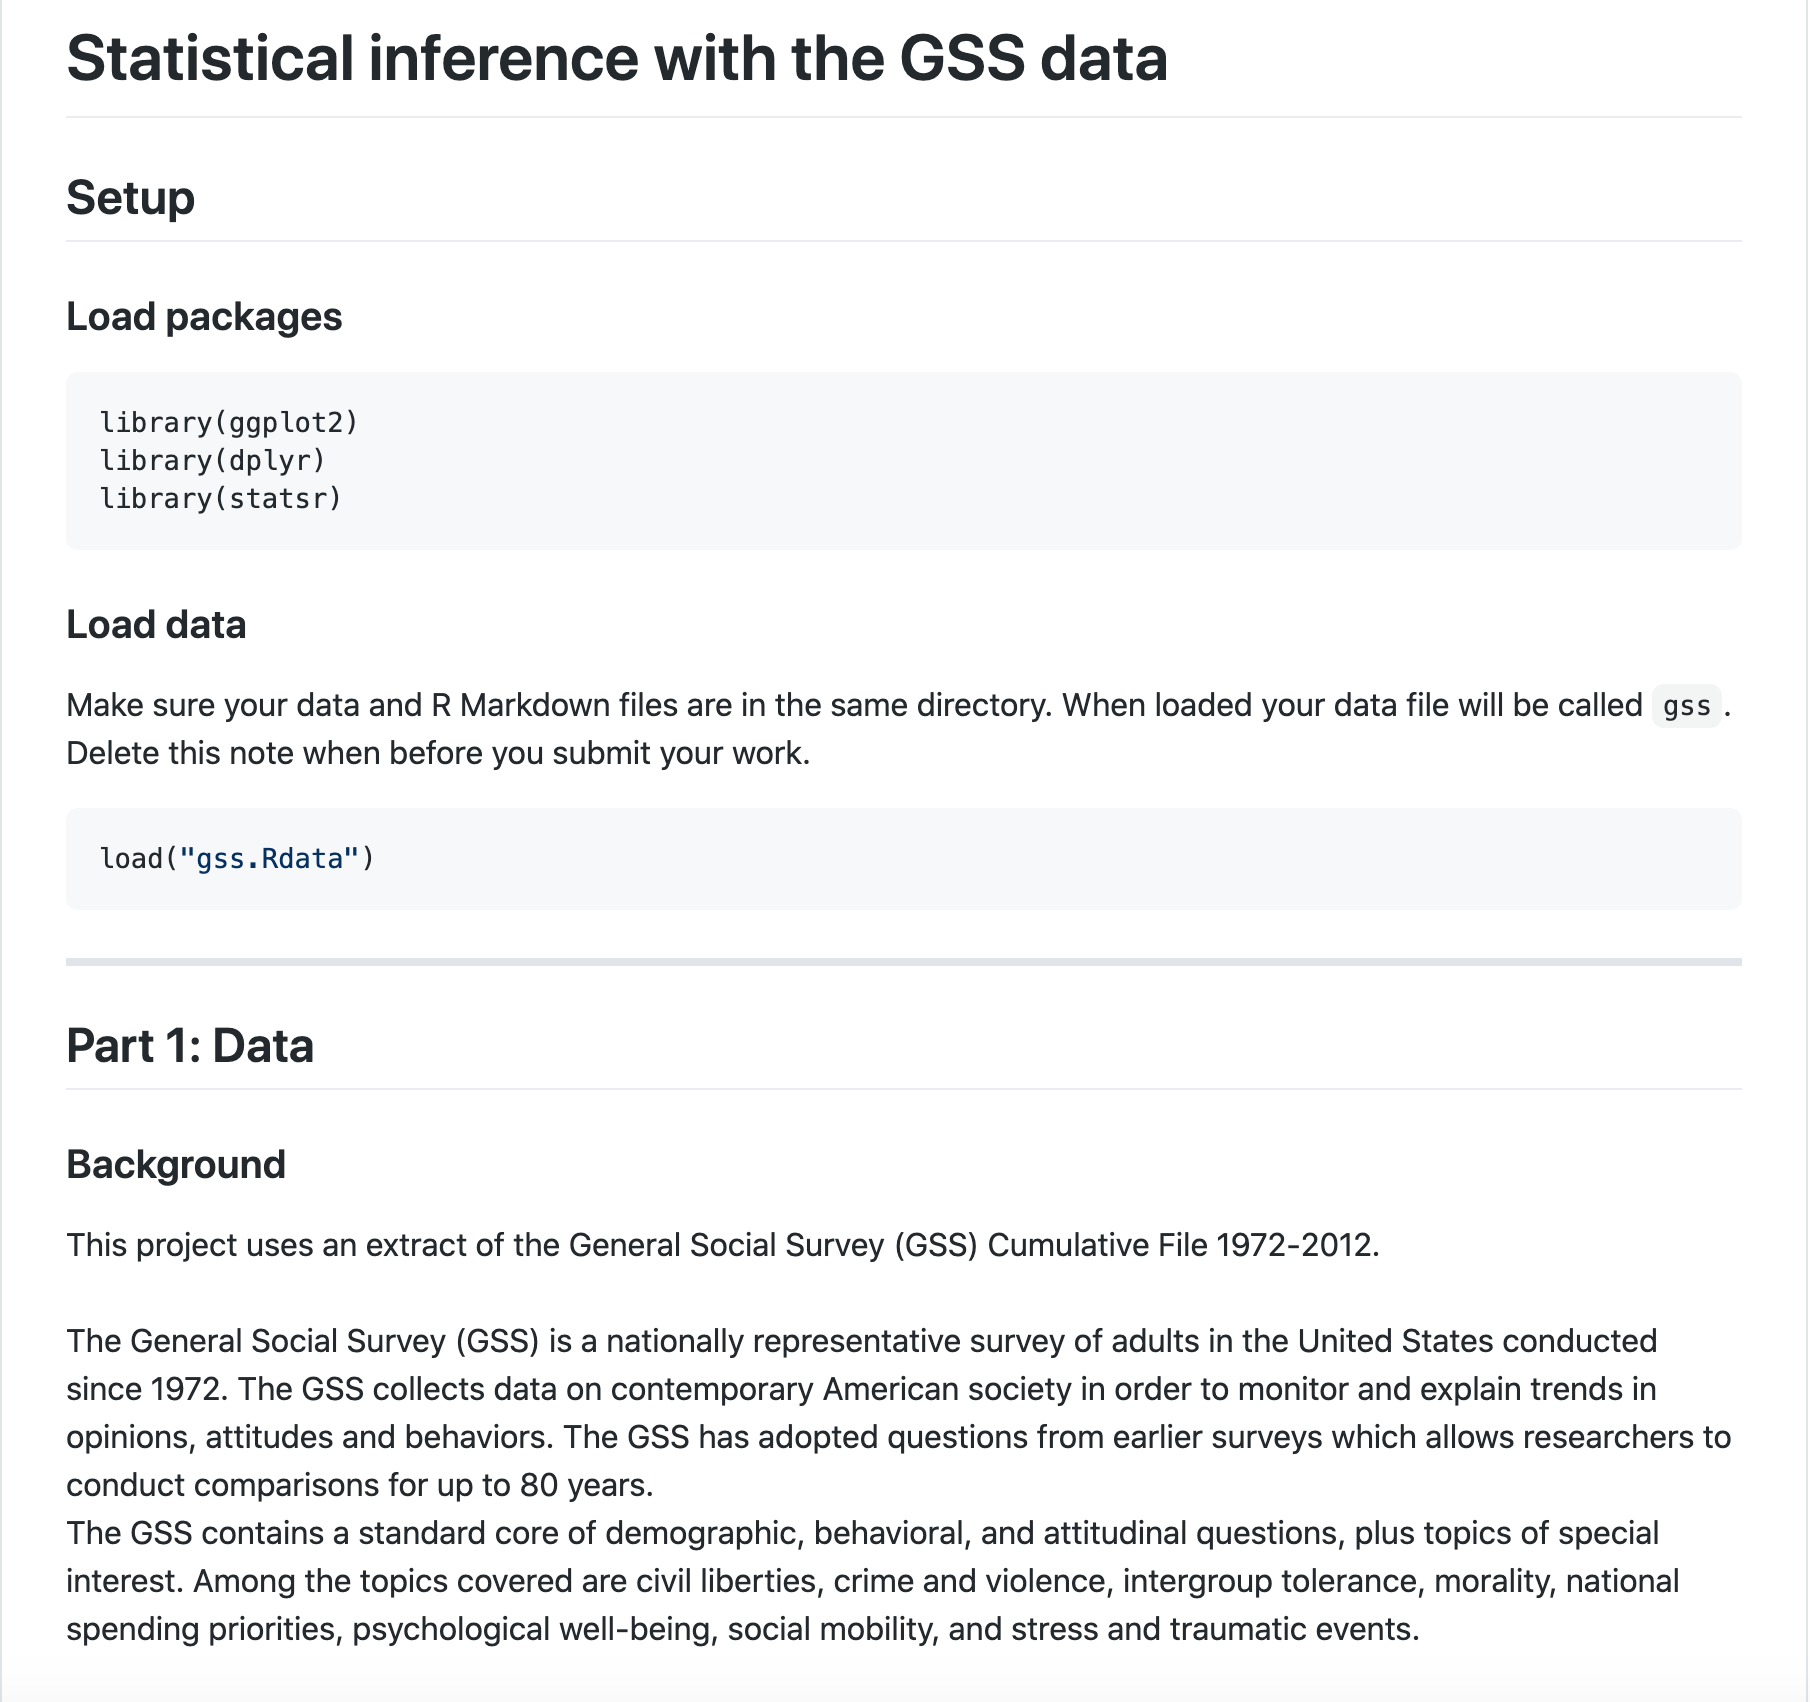
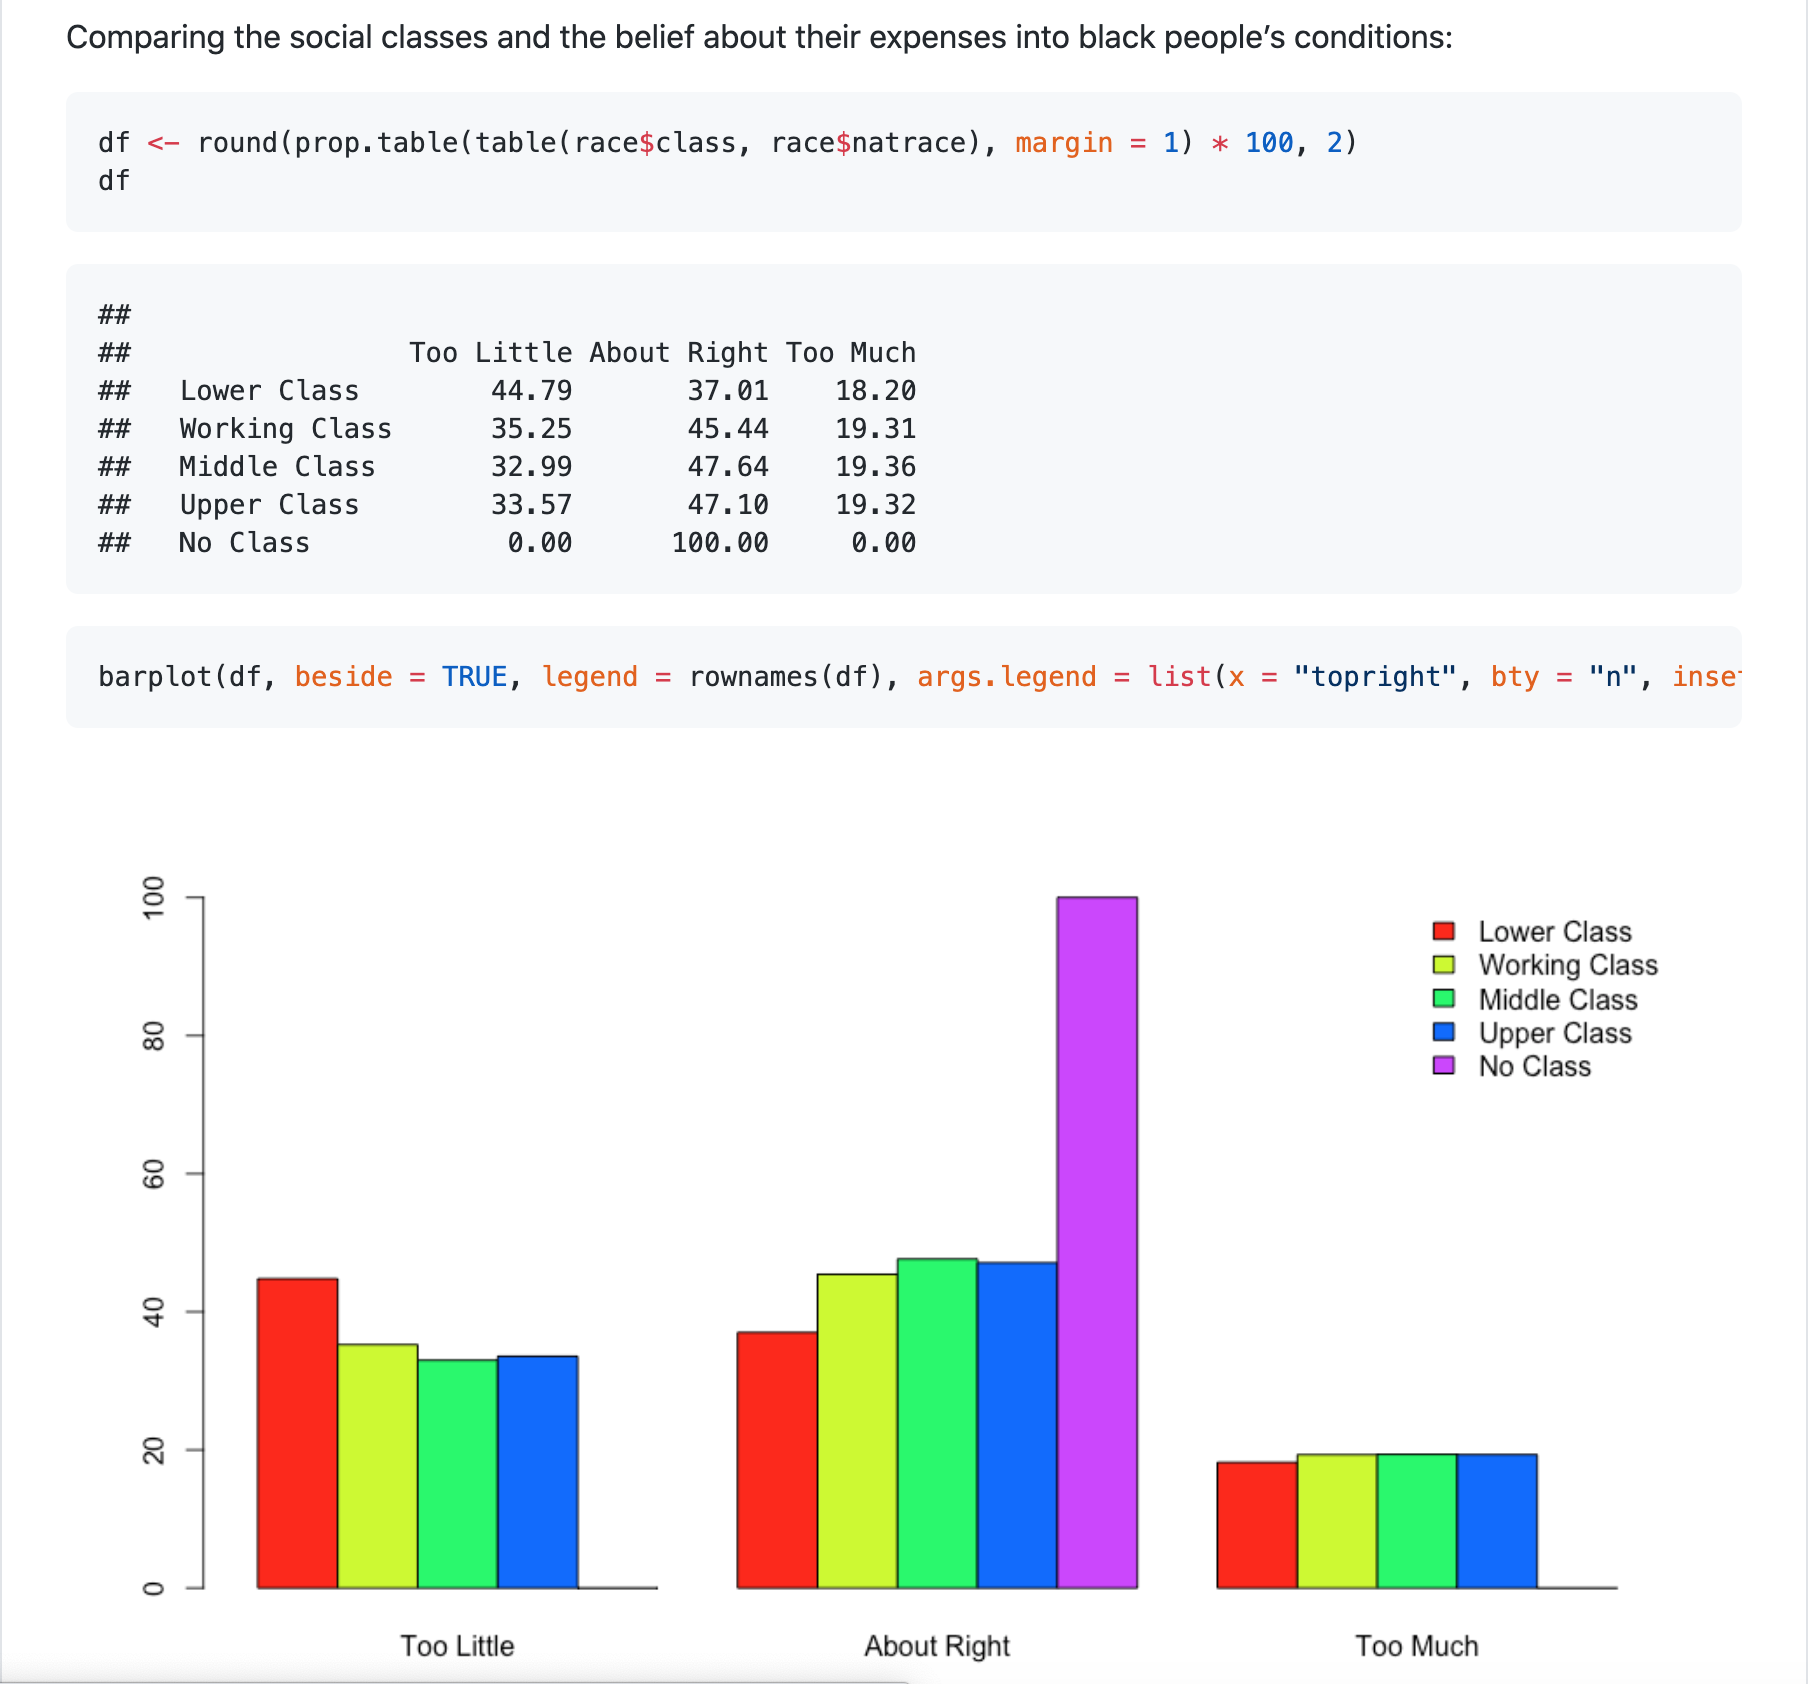
Statistical inference with the GSS data
A study about racism in the US using the GSS summary.
 GitHub
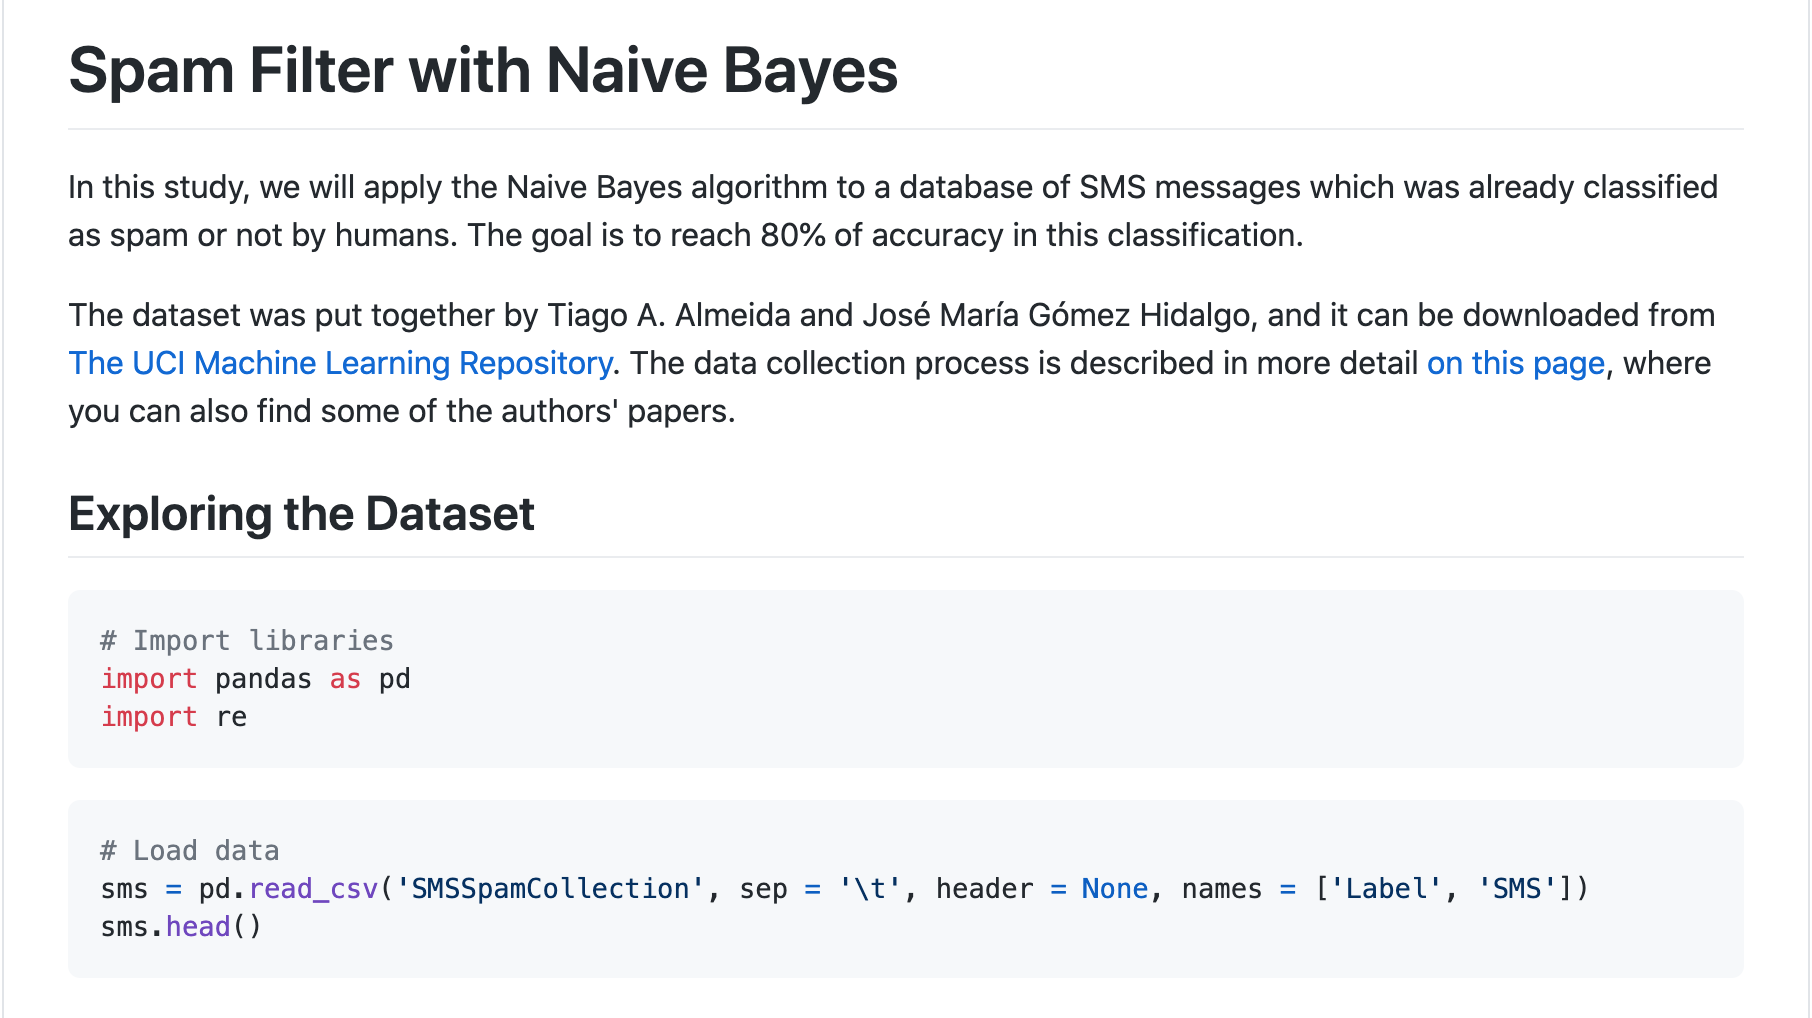
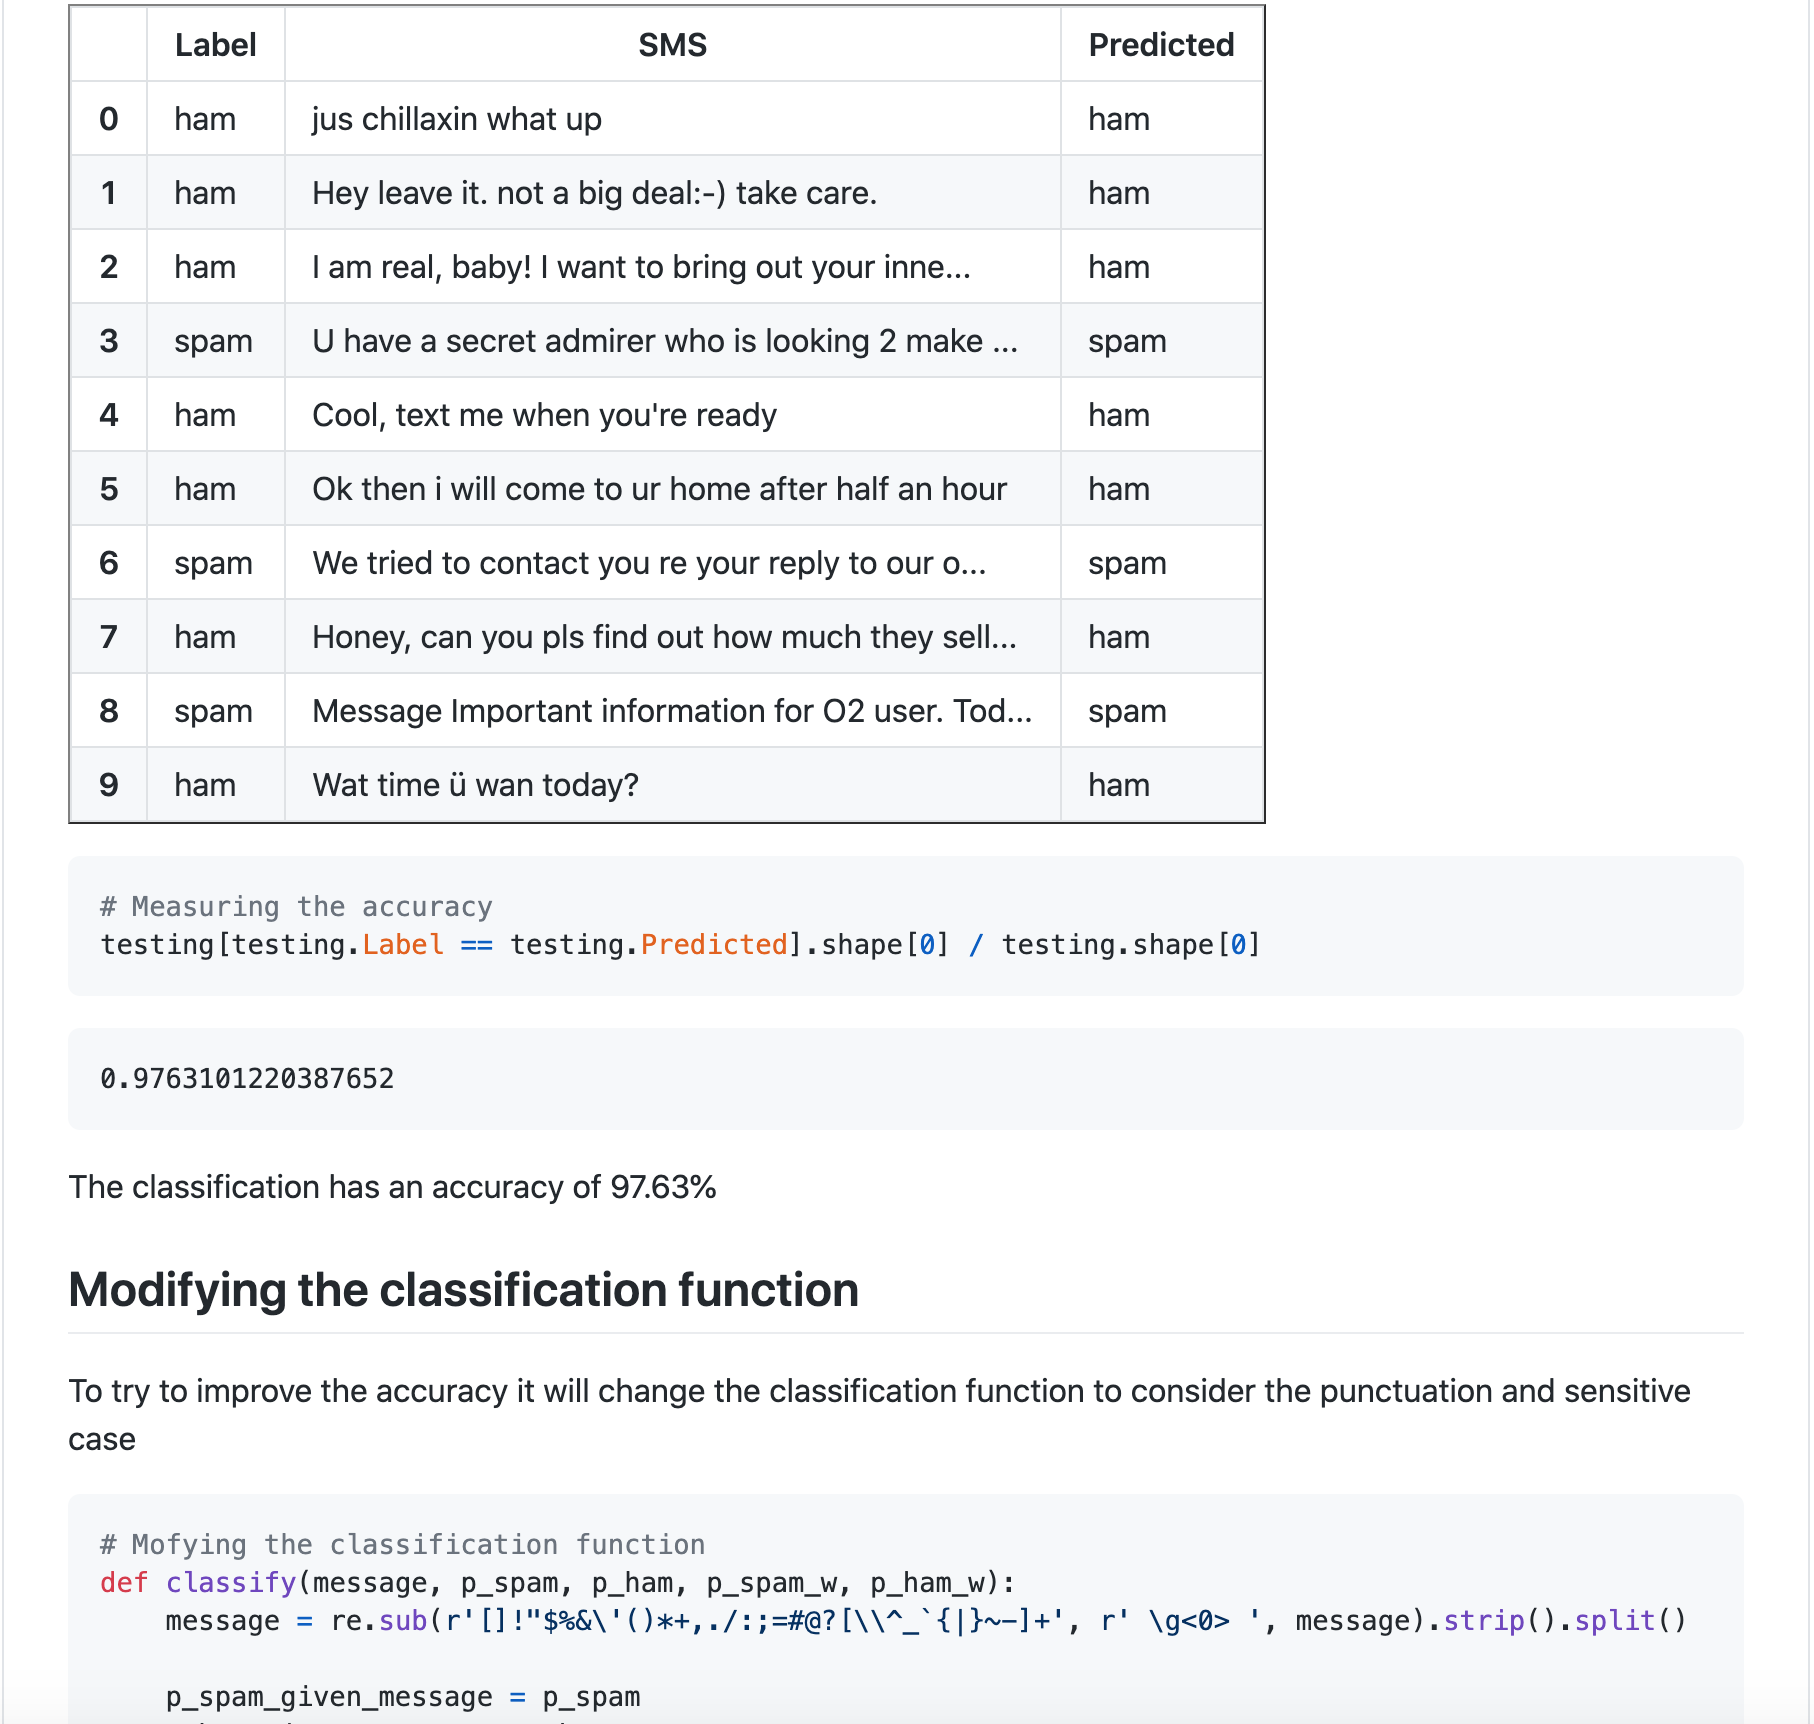
Spam Filter With Naive Bayes
A study about SMS messages and classifying them as spam or not using Naive Bayes.
 GitHub
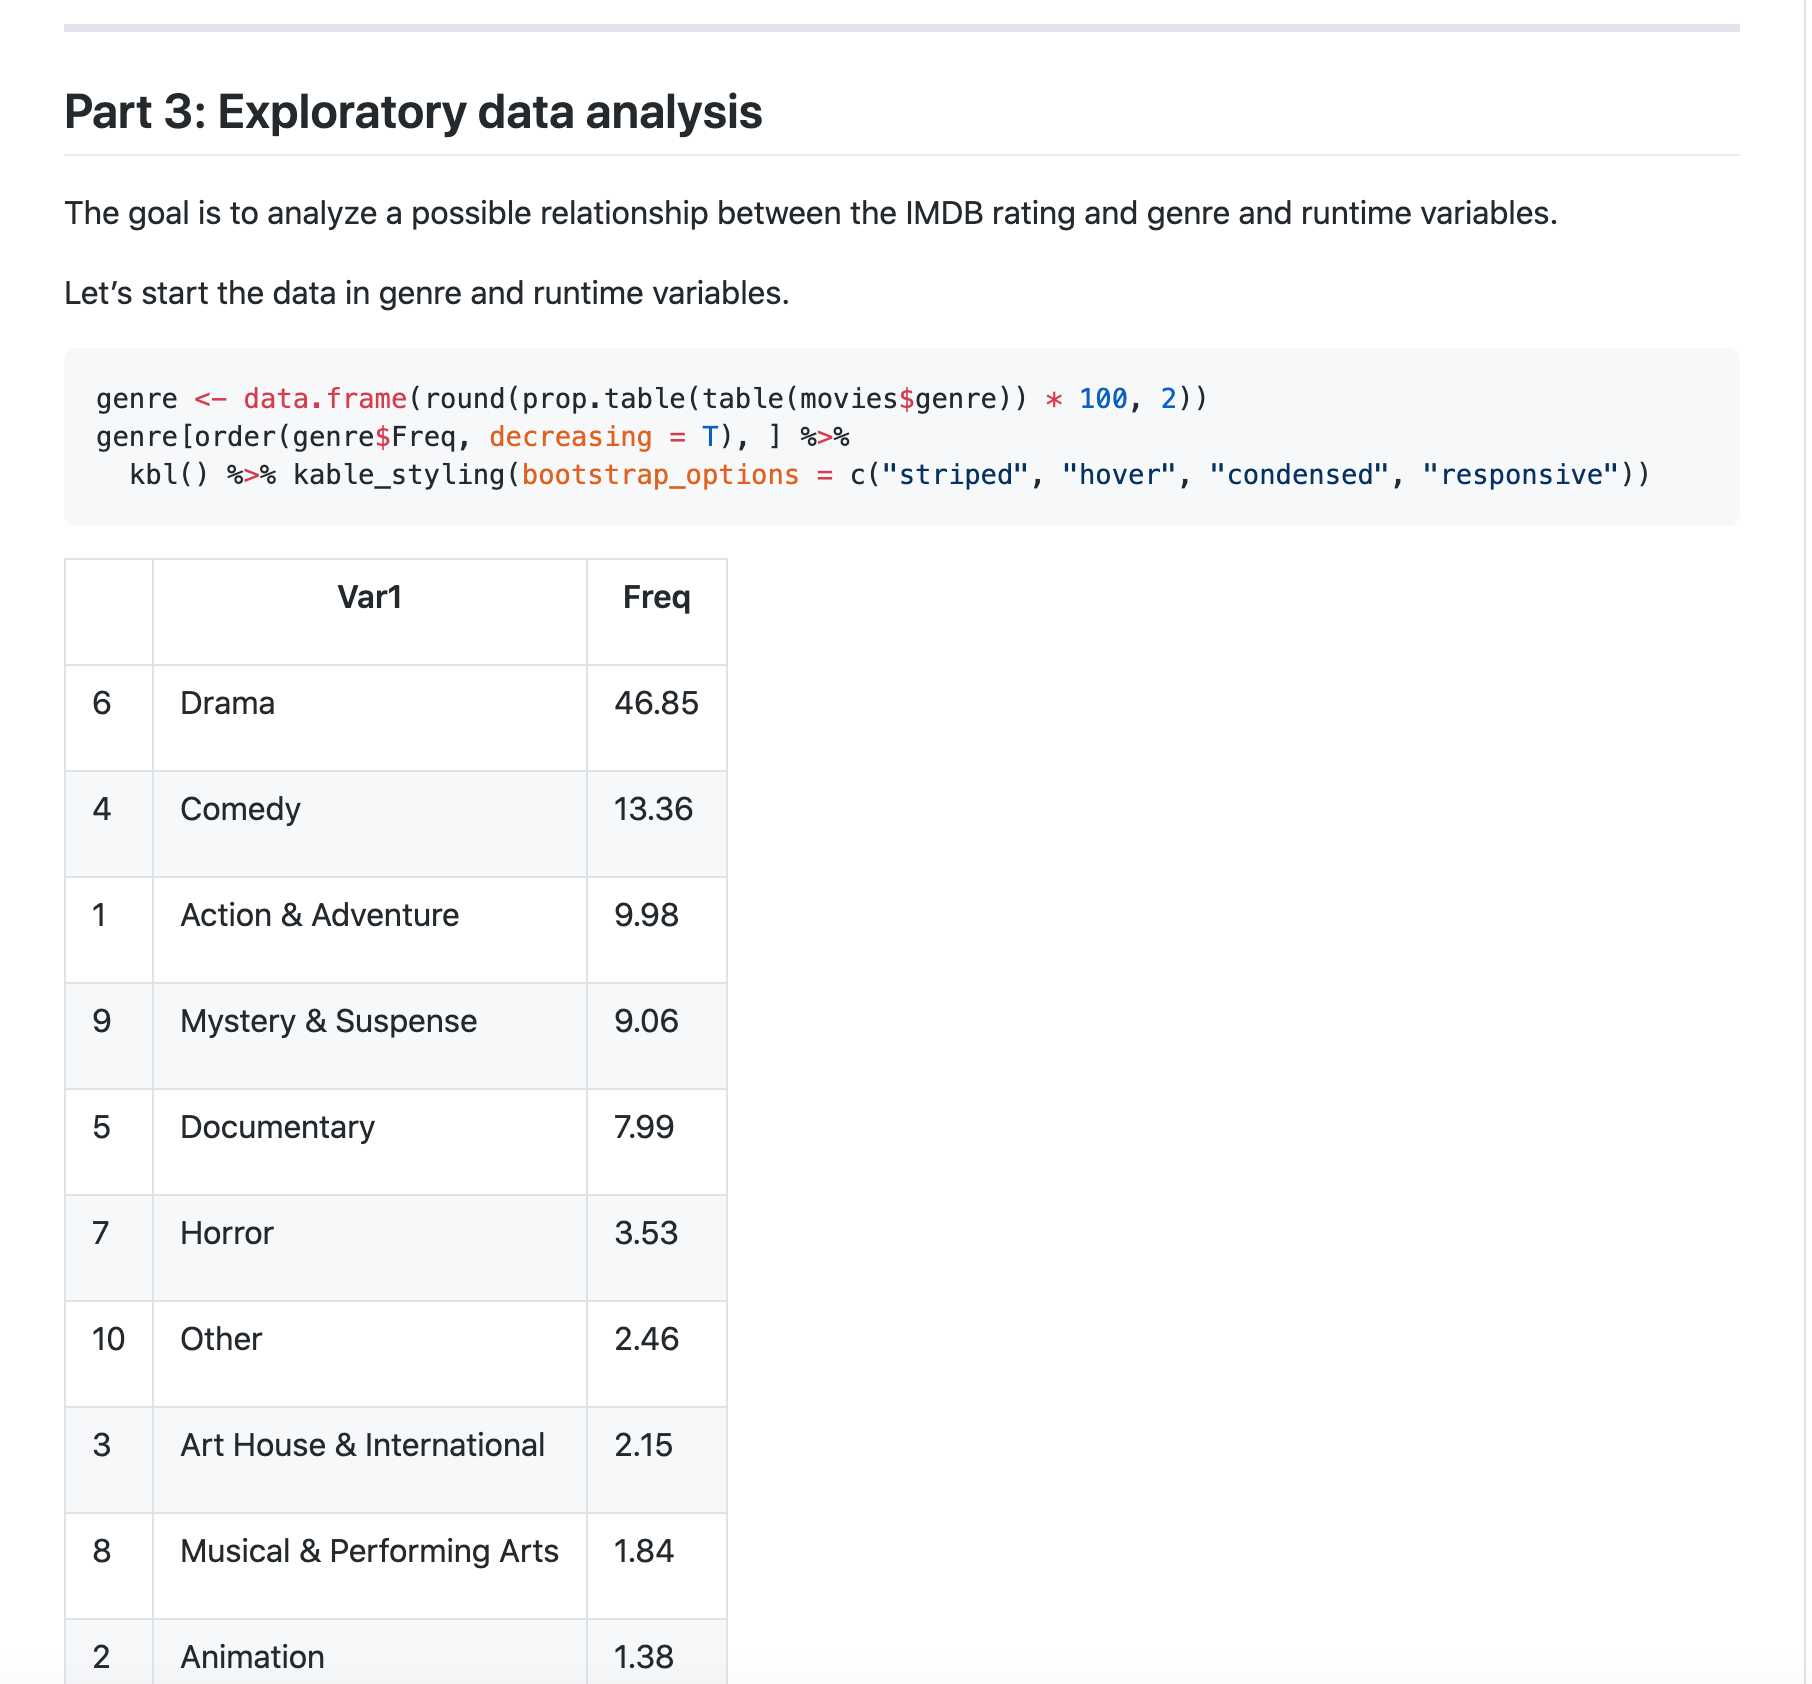
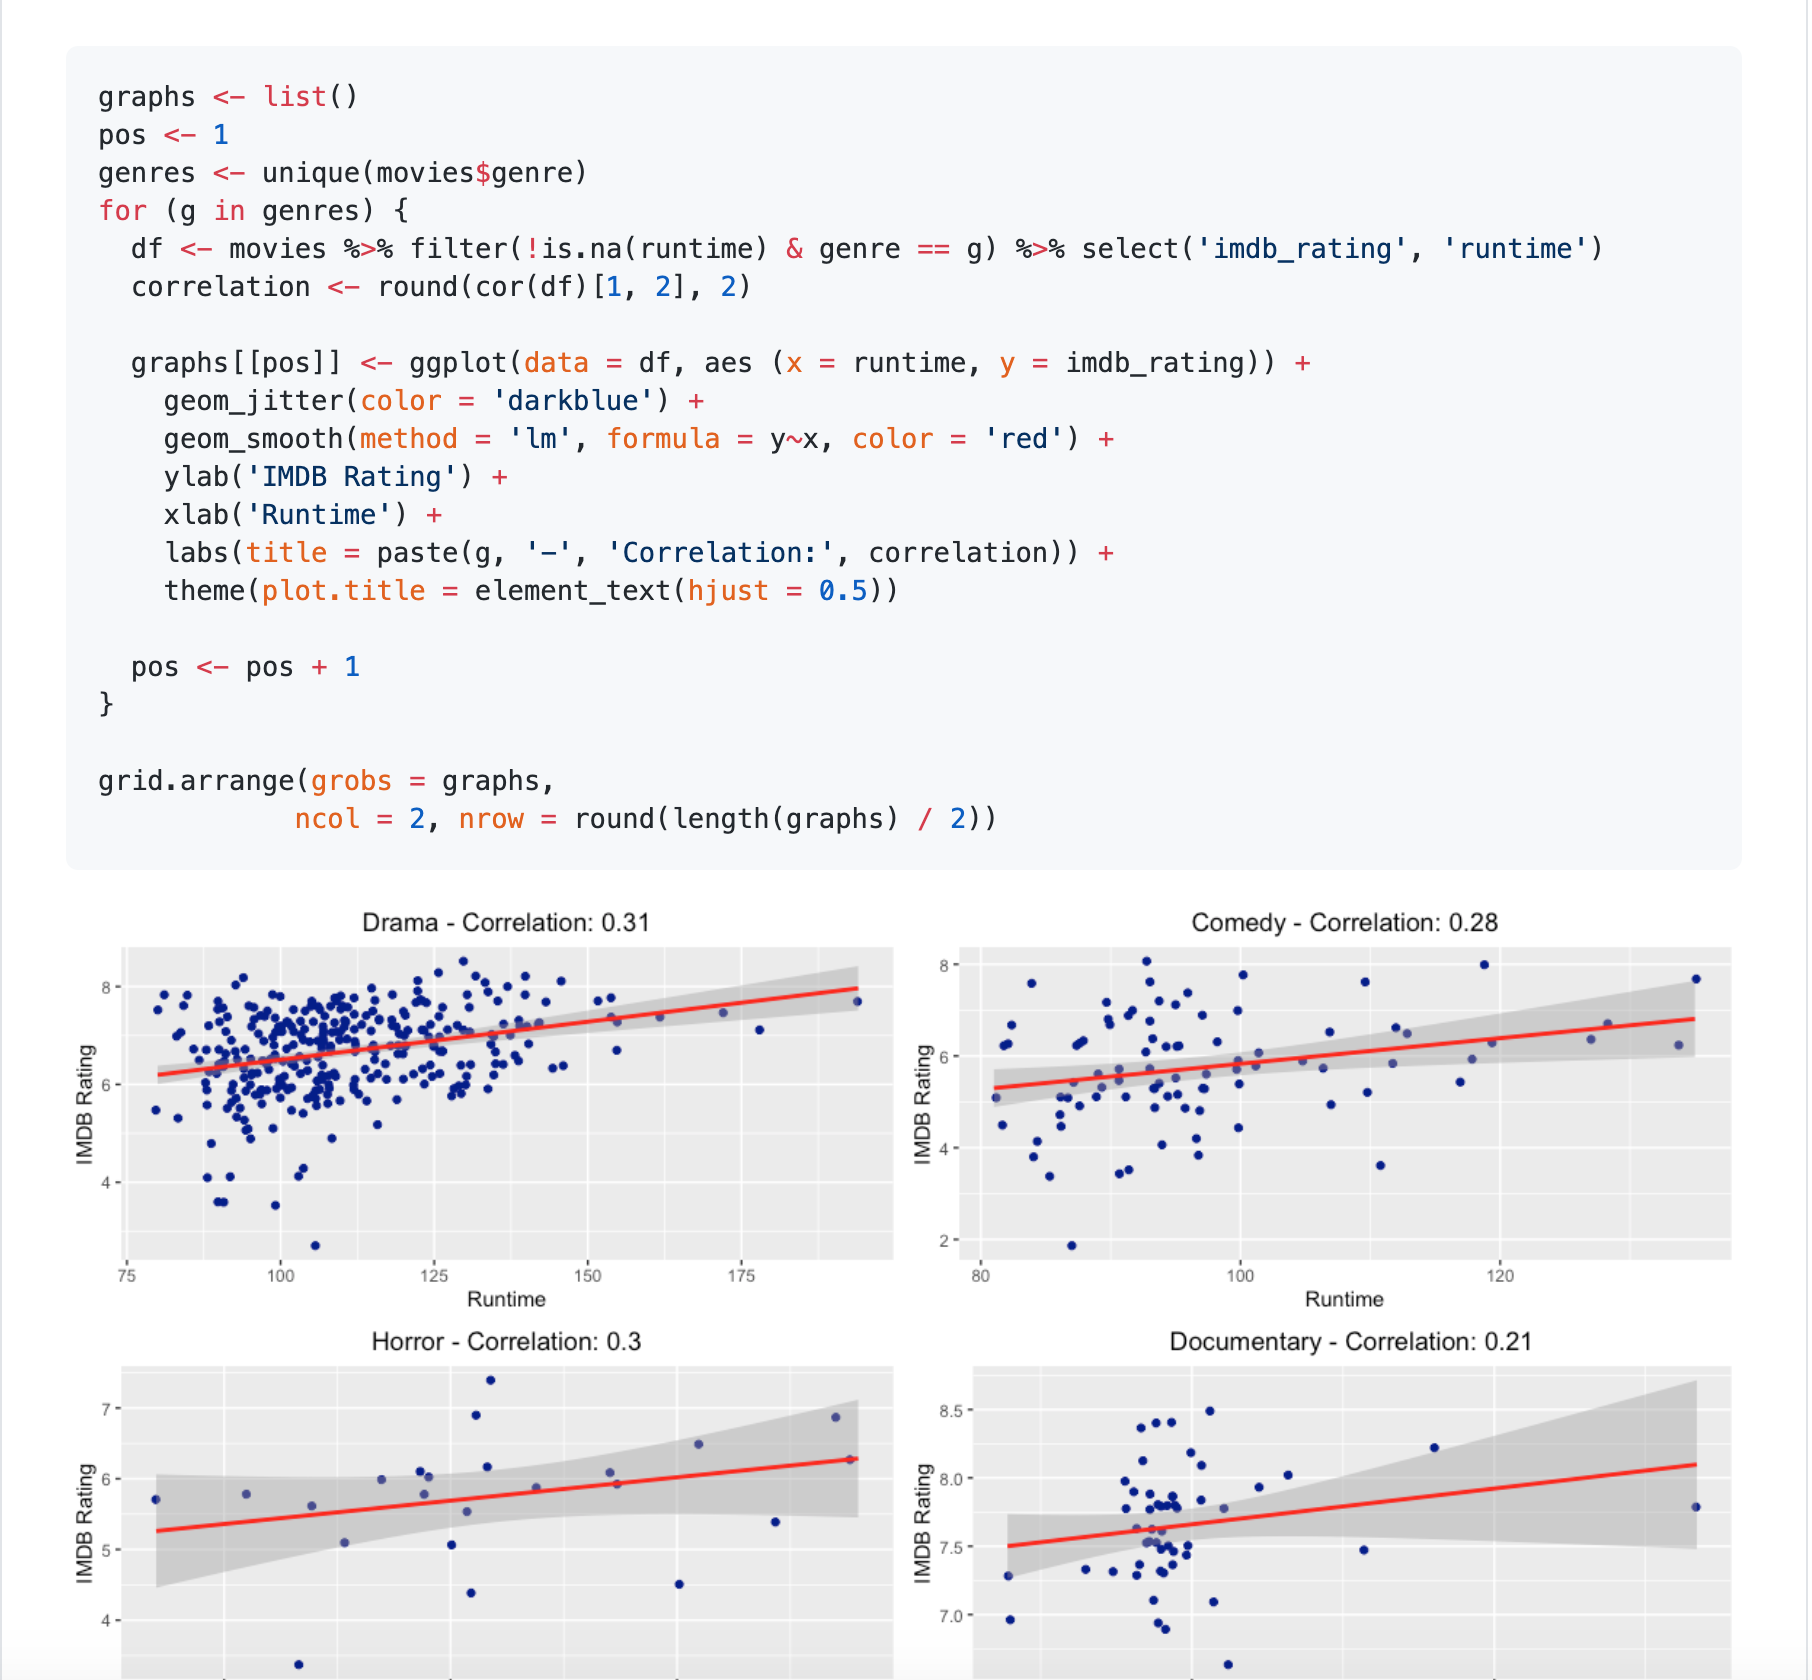
Movies' rates prediction
Modeling and predicting movies' rates using Linear Regression.
 GitHub
Courses
A course using the language R focusing on data analysis to teach one-sample t-test, binomial test, chi-square test for goodness-of-fit, frequency table, cross-table, detect outliers, and more.
A course using the language R to teach statistics, central tendency, the measure of dispersion, probability, normal distribution, hypothesis testing, chi-square, and more.
A course using the language R focusing on data analysis to teach analysis of covariance, multinomial logistic regression, simple and multiple correspondence analysis, binomial logistic regression, cluster analysis, and more.
A specialization, which teachs how to analyze and visualize data in R and create reproducible data analysis reports, demonstrate a conceptual understanding of the unified nature of statistical inference, perform frequentist and Bayesian statistical inference and modeling to understand natural phenomena and make data-based decisions, communicate statistical results correctly, effectively, and in context without relying on statistical jargon, critique data-based claims and evaluated data-based decisions, and wrangle and visualize data with R packages for data analysis.
A hands-on course focused on Data Analyses with Python.
This career path guides the student through a smooth sequence of data analyst courses, covering everything you need to learn to work as a data analyst using Python.
With data analysis courses, you’ll learn the Python fundamentals, dig into data analysis and data viz using popular packages like pandas, query databases with SQL, and study statistics, among other things.
A hands-on Data Science course with SQL, R, and Python.
This course is complete, teaching statistics, data engineering, data analysis, and machine learning.
A complete course about Data Analysis covering Data Analytics, Data Visualization, statistics, and tools like Excel, Power BI, and Tableau.
A course about statistics and how to apply it to Excel.
A course about Excel applying to Data Analysis. The course teaches how to use the most important formulas, create charts, and forecasting.
A course about Power BI Server and Desktop. On the Power BI Desktop side, the course teaches how to import data, clean and transform it. On the Power BI Server is presented how to create, charts, reports, dashboards, and much more.
A course about Tableu. The course teaches how to import data, visualize it in different formats, create dashboards, and much more.
A course in Data Visualization and how to apply it on Tableau.
A course in Data Visualization and communication that explains best practices and how to apply them on Tableau. The course teaches best practices to create data stories and presentations.
A basic course about Hive and Hadoop.
A basic course about Spark, PySpark, and Spark SQL.
A course about Spark that explains how to use PySpark, and Spark SQL. The course teaches Big Data, clean and aggregate data, how to create clusters in AWS, and Machine Learning.
A course about Apache Airflow that teaches how to install, configure, and develop data pipelines.
A course about Apache Airflow and how to develop data pipelines.
A course about Snowflake architecture and features. The course teaches how to create warehouses, databases, schemas, tables, and how to query data.
|